Stepping and Continuing
This section is known as dynamic analysis. Dynamic analysis is actively running the binary and observing its behavior. This is done by watching the registers, the stack, and the instructions as they are executed.
Using Breakpoints
Breakpoints are how we can pause execution to analyze the binary. We can set a breakpoint using the break command (b for short). It takes a secondary argument of the address to break at. You have to dereference the address; otherwise, gdb will assume you are attempting to name a function.
gef➤  b *0x0804923c
Breakpoint 1 at 0x804923c
Moreover, we can also set breakpoints at the start of specific functions:
gef➤  b read_in
Breakpoint 2 at 0x80491f3
Or a function plus an offset. Since a function plus an offset returns an address, we must dereference it.
gef➤  b *(win+38)
Breakpoint 3 at 0x80491cc
An Important Distinction
There is an essential difference between
b read_in and b *read_in. Although both will stop execution inside read_in, they choose different locations.b *mainbreaks on the first instruction of the function.b mainbreaks on the first instruction after the function prologue.
Most of the time, this distinction will not matter. However, many exploits concerning Patching and Jumping will be sensitive to this distinction.
The Breakpoint List
You can use info breakpoints (info break for short) to see the current breakpoints set.
gef➤  info break
Num     Type           Disp Enb Address    What
1       breakpoint     keep y   0x0804923f <main+3>
2       breakpoint     keep y   0x080491f3 <read_in+4>
3       breakpoint     keep y   0x080491cc <win+38>
We need this menu to get the breakpoint number for each breakpoint. We use this to disable or delete breakpoints.
Disabling Breakpoints
We can enable or disable breakpoints based on their number. This is useful to temporarily disable a breakpoint without deleting it.
gef➤  disable 2
gef➤  enable 2
Info
Breakpoints are enabled by default.
Deleting Breakpoints
We can use this menu to delete breakpoints by their number. We can use delete (or d for short).
gef➤ d 3
Setting Watchpoints
A watchpoint is a breakpoint triggered when a specific memory address is accessed. This is useful for debugging when a specific memory address is accessed.
You can set a watchpoint to watch a register:
gef➤  watch $esp
Watchpoint 2: $esp
You can also watch an instruction or a hardcoded location:
gef➤  watch *(read_in+59)
Hardware watchpoint 3: *(read_in+59)
The Watchpoint List
You can use info watchpoints (info watch for short) to see the current watchpoints set.
gef➤  info watch
Num     Type           Disp Enb Address    What
2       watchpoint     keep y              $esp
3       hw watchpoint  keep y              *(read_in+59)
Running the Binary
You can run the binary using the run command (r for short). Without any breakpoints set, this doesn't do much:
gef➤  r
Starting program: /ironforge/args
[Thread debugging using libthread_db enabled]
Using host libthread_db library "/lib/x86_64-linux-gnu/libthread_db.so.1".
Good luck winning here!
ok
[Inferior 1 (process 79132) exited with code 0130]
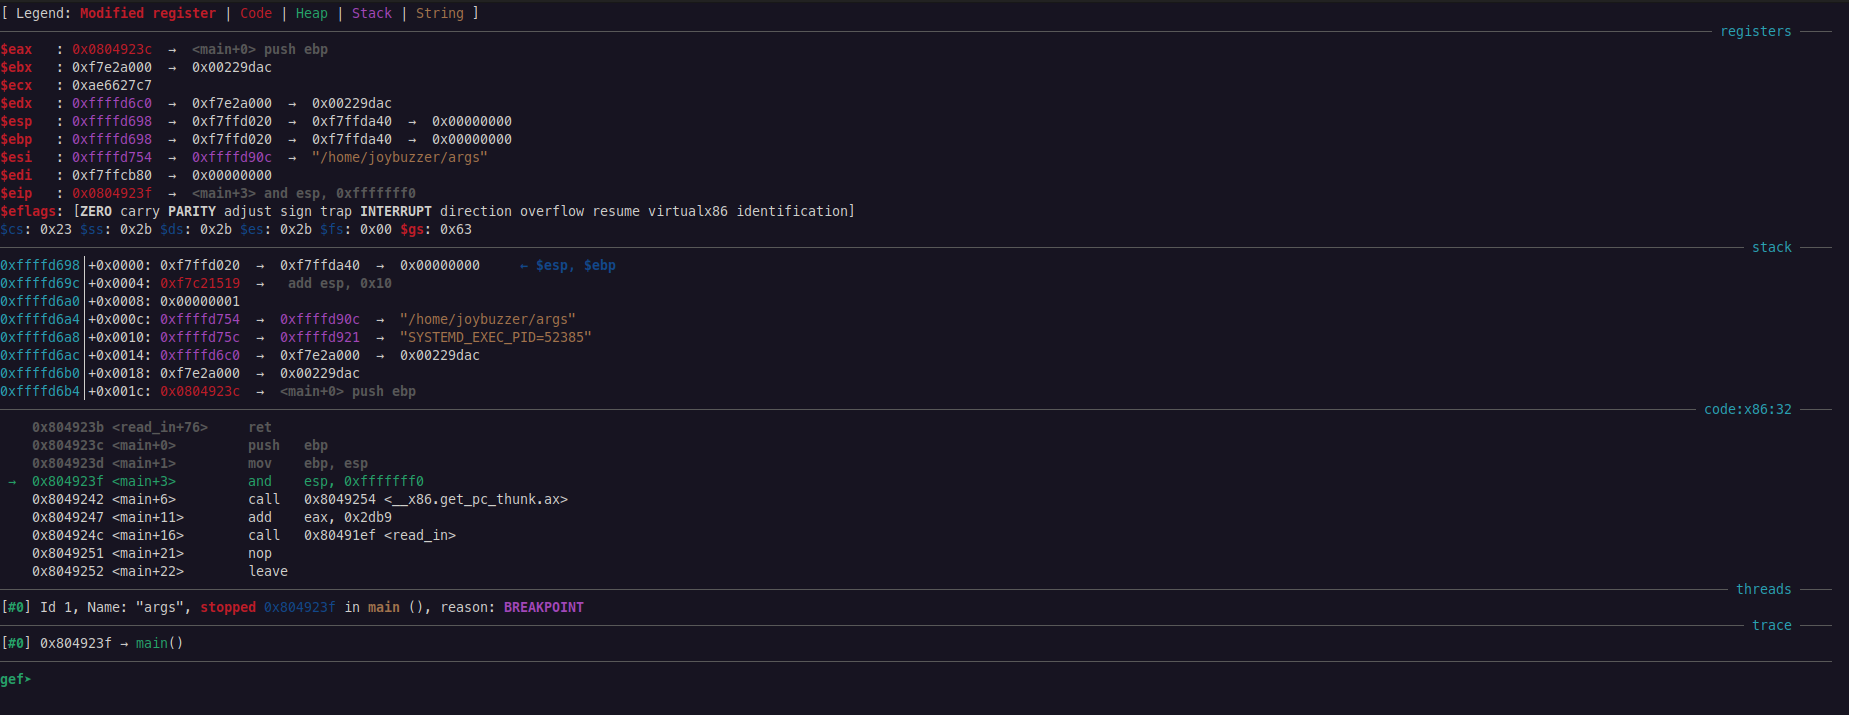
However, if we set a breakpoint, we can see the binary pause at the breakpoint:
Warning
This output is displayed because we installed GEF. If you did not install GEF, this output does not preview at runtime. This is one of the major benefits of GEF and why I recommend it.
The binary is now running. GEF provides us with information on the essential registers, the stack frame, the instruction set, and the call stack.
Stepping
There are two kinds of steps when using a debugger: stepping in and stepping over.
- Step In: This method steps into any called functions and pauses at the first instruction. This allows you to walk through called functions.
- Step Over: This method steps over a function and immediately executes all its contents. This is useful for library functions where their instructions aren't important.
To step in, use the si instruction. To step over, use the ni instruction. You can use ni <num> (or si <num>) to step that many instructions. gdb also remembers your most recent instruction, so pressing Enter will repeat your last instruction.
For the current binary, running the following will get us into read_in:
gef➤  ni
gef➤
gef➤
gef➤  si
Continuing
You can use the continue command (c for short) to execute until the next breakpoint or watchpoint is hit.
gef➤  c
Continuing.
You can use the finish command to continue running until the current function returns.
gef➤ finish
The until (u for short) command continues execution until the program counter is greater than the jump address. This is useful for stepping over loops.
gef➤ u
The advance function continues running until a specified location. This is the same as using a breakpoint without having to permanently set a breakpoint.
gef➤ advance 0x804923c
Stack Traces
A stack trace is a list of all the functions that have been called up to this point. This is useful for debugging and understanding the flow of the program.
To view the stack trace, use the backtrace command (bt for short).
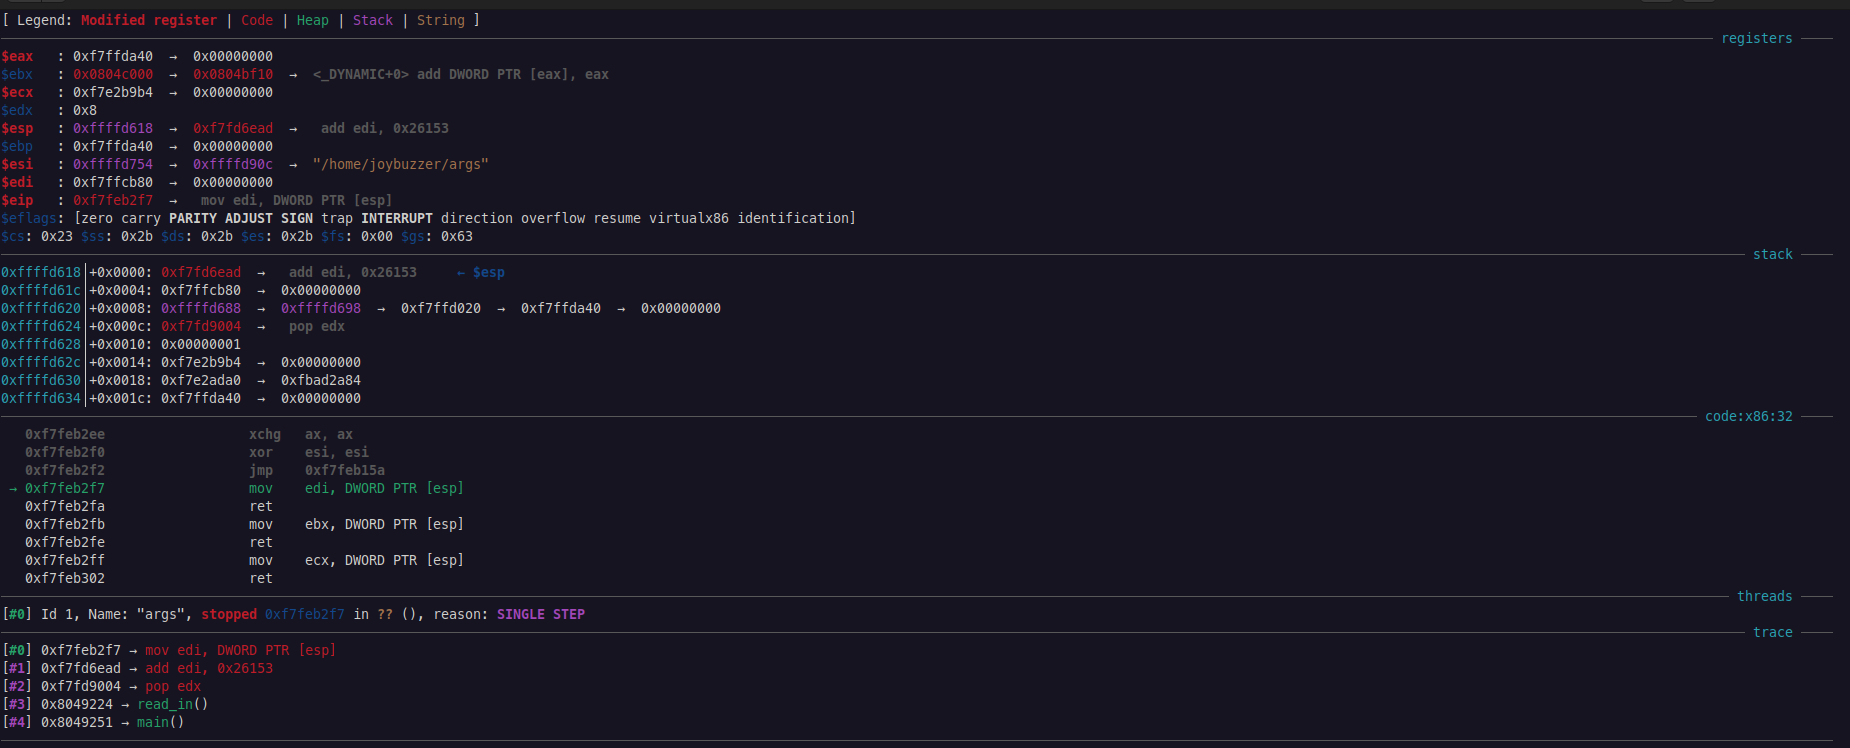
gef➤  bt
#0  0xf7feb2f7 in ?? () from /lib/ld-linux.so.2
#1  0xf7fd6ead in ?? () from /lib/ld-linux.so.2
#2  0xf7fd9004 in ?? () from /lib/ld-linux.so.2
#3  0x08049224 in read_in ()
#4  0x08049251 in main ()
Info
I stepped into a random location to show many stack frames. This comes from an STL function calling other STL functions inside the
ld file.GEF also previews this stack trace:
Moving Up and Down the Stack
You can use up and down to move up and down the stack trace. This is useful for viewing the contents of the stack frame. These take optional arguments of how many frames to move up or down.
gef➤  up 2
#2  0xf7fd9004 in ?? () from /lib/ld-linux.so.2
Running Backwards
You can run programs in reverse order to better understand how to reach a certain location in a binary. Stepping backward works slightly differently than stepping forward.
Use reverse-stepi (rsi for short) to reverse-executive one machine instruction. This is the same as stepping backward (and in).
gef➤ rsi
Use reverse-nexti (rni for short) to reverse-executive a single instruction in reverse. Called functions are un-executed automatically.
gef➤ rni
reverse-continue (rc for short) will continue execution in reverse until the next breakpoint or watchpoint is hit.
gef➤ rc
reverse-finish takes you to where the current function was called (the top of the function).
gef➤ rf
Debugging Forks
gdb must be instructed on how to follow forks. Since a fork creates a separate process, you must tell gdb how to respond.
Use set follow-fork-mode to set how you want to follow. You can choose to follow the parent or the child.
gef➤ set follow-fork-mode parent
Use show follow-fork-mode to show the active mode.
gef➤  show follow-fork-mode
Debugger response to a program call of fork or vfork is "parent".
gdb can also detach a process after a fork to retain debugger control over both. The mode can be on (the follow-fork-mode process will be detached and will run independently) or off (both processes are held under gdb, one suspended while debugging the other).
gef➤ set detach-on-fork on
Again, show detach-on-fork shows the current mode.
gef➤  show detach-on-fork
Whether gdb will detach the child of a fork is on.
Finally, follow-exec-mode sets the debugger's response to an exec call. The mode can be new (gdb creates an inferior process and rebinds to it) or same (gdb continues to debug the same process).
gef➤ set follow-exec-mode new
show follow-exec-mode shows the current mode.
gef➤  show follow-exec-mode
Follow exec mode is "new".