The last lesson ended with a listing of what Ghidra makes of a small program. This lesson is about getting to that listing yourself. We install Ghidra, load a binary, and walk through the handful of windows you will spend the course in. Then we make our first corrections to the decompiler's guess, which is where the real work of reverse engineering starts.
Ghidra is a large program with a lot of buttons, and most of them can be ignored. The goal here is to know which few matter.
We use the same chall as the last lesson, the PIN check with the scramble helper. If you do not have it, grab the download from that page. Using a program whose source we have already read means we can check everything Ghidra tells us.
Ghidra is not in most package managers, and the cleanest way to set it up on any distribution is to download a release and add it to your path by hand.
Install Java. Ghidra 12 needs JDK 25. Install it with your system's package manager: openjdk-25-jdk on Ubuntu and Debian, java-25-openjdk-devel on Fedora, and the equivalent elsewhere. Older Ghidra releases need older JDKs, and each release lists its requirement.
Download and extract Ghidra. Take the latest release from the Ghidra releases page and extract it wherever you keep tools:
unzip ghidra_<version>_PUBLIC.zip -d ~/toolsAdd it to your path. The launcher is ghidraRun, inside the extracted folder. Symlink it into ~/.local/bin so you do not have to navigate there every time:
ln -s ~/tools/ghidra_<version>_PUBLIC/ghidraRun ~/.local/bin/ghidraRunMake sure ~/.local/bin is on your PATH. Most shells add it automatically. If yours does not, add export PATH="$HOME/.local/bin:$PATH" to your shell profile. After that, running ghidraRun from anywhere starts Ghidra.
Ghidra keeps its work in projects. A project is a folder holding every binary you have imported, along with the names, types and comments you have added to each. The first time you start Ghidra, create one with File > New Project, choose Non-Shared Project, and give it a name and a location.
The window you are looking at is the Project Window. It lists the project's binaries, and the row of icons under Tool Chest holds Ghidra's tools. The green dragon is the CodeBrowser, the only one this course uses.
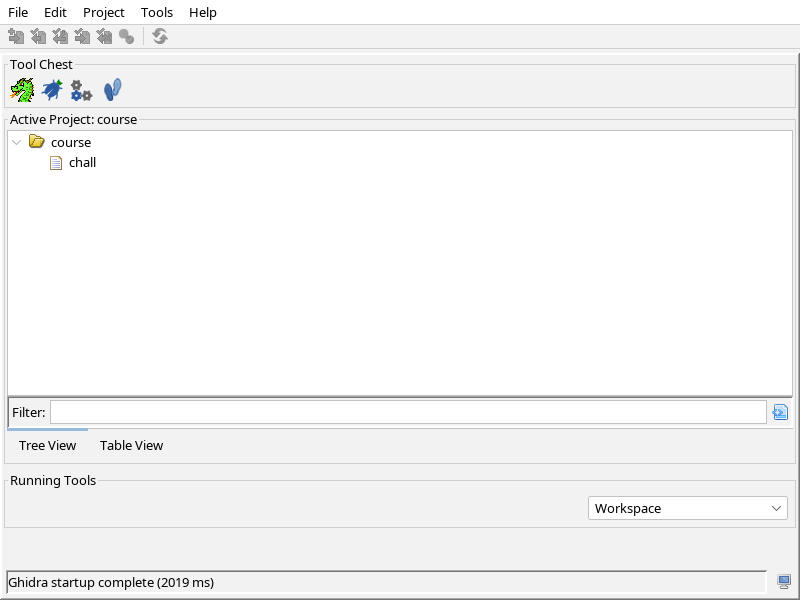
To add a binary, press I or use File > Import File, and pick chall. Ghidra inspects the file and proposes how to load it:
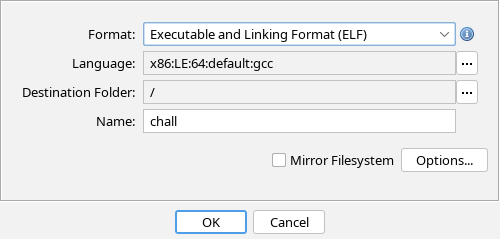
It has worked out the same things file told us in the first lesson. The format is ELF, and the language x86:LE:64:default:gcc means x86, little-endian, 64-bit, built by GCC. For ordinary binaries these guesses are right, so click OK. Ghidra then shows a summary of what it loaded, which you can close.
Double-click chall in the project window to open it in the CodeBrowser. Ghidra notices the binary is new and offers to analyze it. Say yes, and it shows a list of analyzers:
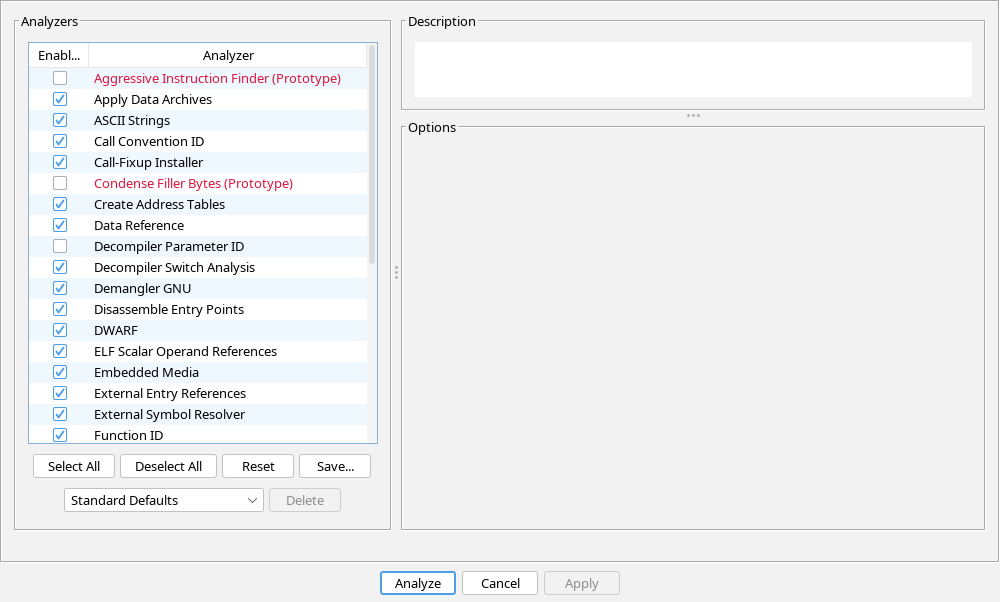
Analysis is where Ghidra does its own static analysis before you start yours. It finds where functions begin and end, follows calls and jumps, marks strings, and matches known library functions. Everything you see afterwards is built on this pass.
The defaults are good, so click Analyze. For a program this small it finishes at once. A large binary can take minutes, with progress shown in the bottom-right corner, and it is worth waiting for it to finish before you trust what is on screen.
This is the window you will work in:
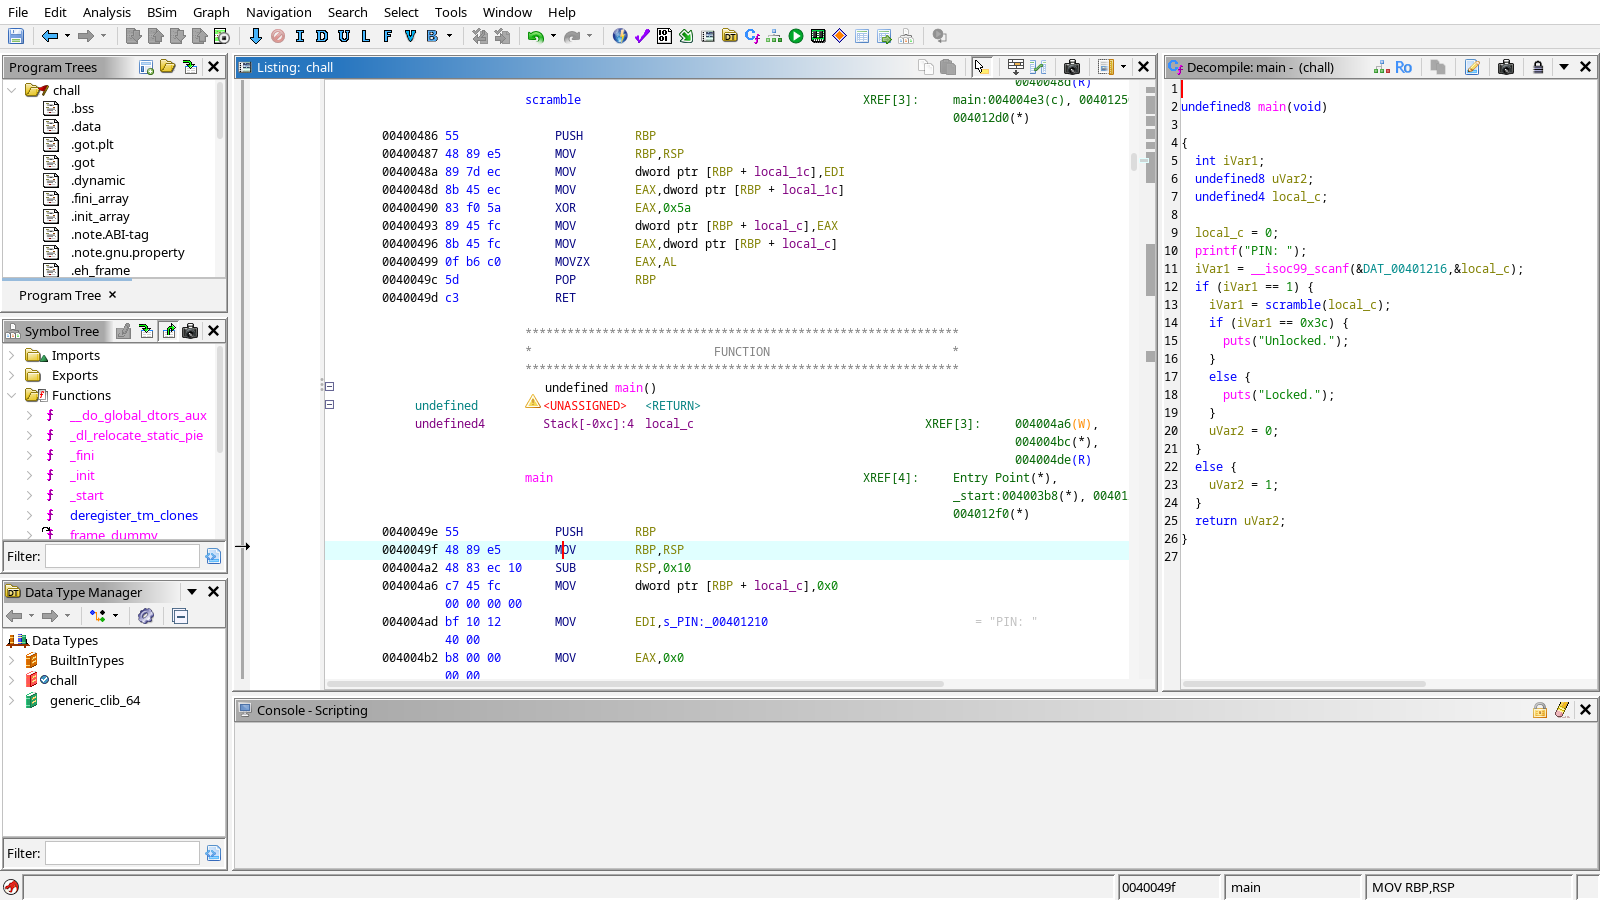
It is busy, but only three parts need your attention at first.
The large pane in the middle is the Listing: the disassembly of the whole binary, top to bottom. Each line has an address, the raw bytes, and the instruction. It is the same information objdump gave us, with extras. Ghidra draws a banner above each function, replaces stack offsets with names like local_c, and notes what else refers to each address under XREF.
The Listing is the ground truth. When the decompiler shows something you do not believe, this is where you check it.
The pane on the right is the Decompiler. It shows C for whichever function the cursor is in, and the two panes stay in sync: click a line of C and the Listing highlights the instructions it came from, and the other way around. In the screenshot it shows main, and the code matches the listing from the last lesson, undefined4 local_c and all.
You will read here most of the time. Double-click a function name in the C, such as scramble, to jump into that function. Alt+Left takes you back.
On the left, the Symbol Tree lists every name Ghidra knows. Imports holds the library functions the program calls, which for chall are printf, puts and scanf. Functions holds the functions inside the binary. Open it and you will find main and scramble, surrounded by names like _start and frame_dummy. Those are the startup functions the linker added in the last lesson, and you can ignore them.
Double-click any name to jump to it. In a binary with thousands of functions, type in the Filter box at the bottom to narrow the list.
The remaining panes can wait. The Program Trees pane lists the file's sections, the Data Type Manager holds type definitions that the Data & Types lesson puts to use, and the Console prints script output. Two windows that are not open by default are worth knowing about, both under the Window menu:
Function Graph draws the current function as boxes of code joined by arrows, one arrow per jump. It makes branches and loops visible at a glance, and Control Flow relies on it.Defined Strings lists every string Ghidra found, like strings with the addresses attached. Strings & Constants starts there.To go straight to an address or a name, press G and type it.
A decompiler's first output is a draft. Ghidra expects you to correct it, and it carries each correction through the rest of the program. That is the difference between reading a binary in Ghidra and reading it in objdump: your understanding gets saved into the tool as you go.
We know from the source that local_c holds the PIN. Even without the source we could tell: it is the variable scanf fills in right after the program prints PIN: . Click local_c in the Decompiler and press L:
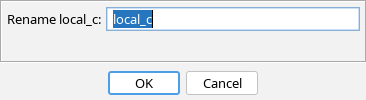
Type pin and press Enter. Every use of the variable changes, in the Decompiler and in the Listing.
L renames whatever is under the cursor, including functions. In a stripped binary, turning FUN_00400486 into scramble once you have worked out what it does is the most useful thing you can do, because the new name shows up in every function that calls it.
Ghidra typed the variable as undefined4: four bytes, meaning unknown. We can do better. It is passed to scanf with %d, so it is an int. Click the variable and press Ctrl+L, then type int. The Decompiler now reads:
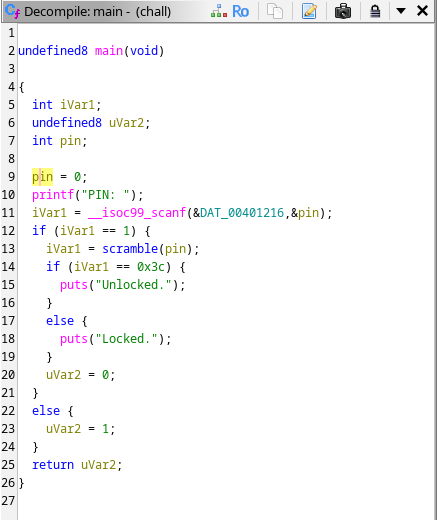
This one was cosmetic. Types matter far more once pointers and structs are involved, where the right type turns a page of pointer arithmetic into named fields. To change a function's return type and parameters in one go, click its name and press F.
Press ; on any line to attach a comment. Use it for conclusions that a name cannot hold, such as "only the low byte is compared" on the call to scramble. Comments are saved with the project, so they are still there next week.
None of this changes the binary. Names, types and comments live in the Ghidra project. They are your notes, kept where you need them.
Ghidra is a static tool. It never runs the program, so it cannot tell you what value a variable holds at some moment during a run. That question belongs to a debugger, and the GDB Guide covers one.
Its output also has habits worth learning early:
local_c sits 0xc bytes below the return address, and the Listing shows it as Stack[-0xc]. Two variables with nearby numbers are neighbors on the stack.local_28, local_20, local_18 and so on, because nothing in the binary says they belong together. Recognizing that pattern and rebuilding the array is part of the job.undefined4, and a wrong guess can make correct code look strange. In the last lesson Ghidra decided scramble takes a byte where the source said int.When the Decompiler and the Listing disagree, believe the Listing.
Ghidra is not always the right tool. Starting it, importing and analyzing takes a minute or two, and some questions do not need it.
file and strings answer in a second.objdump -d is often enough. The first lesson solved a whole challenge with it.A rule of thumb: start with the quick tools, and move to Ghidra once you find yourself tracking more than one function in your head.
I, open it in the CodeBrowser, and let the default analysis run.L renames, Ctrl+L retypes, ; comments, and G jumps to an address or name.With the tools in place, the next section starts on the main skill of the course. Control Flow covers reading branches and loops in decompiled code.
